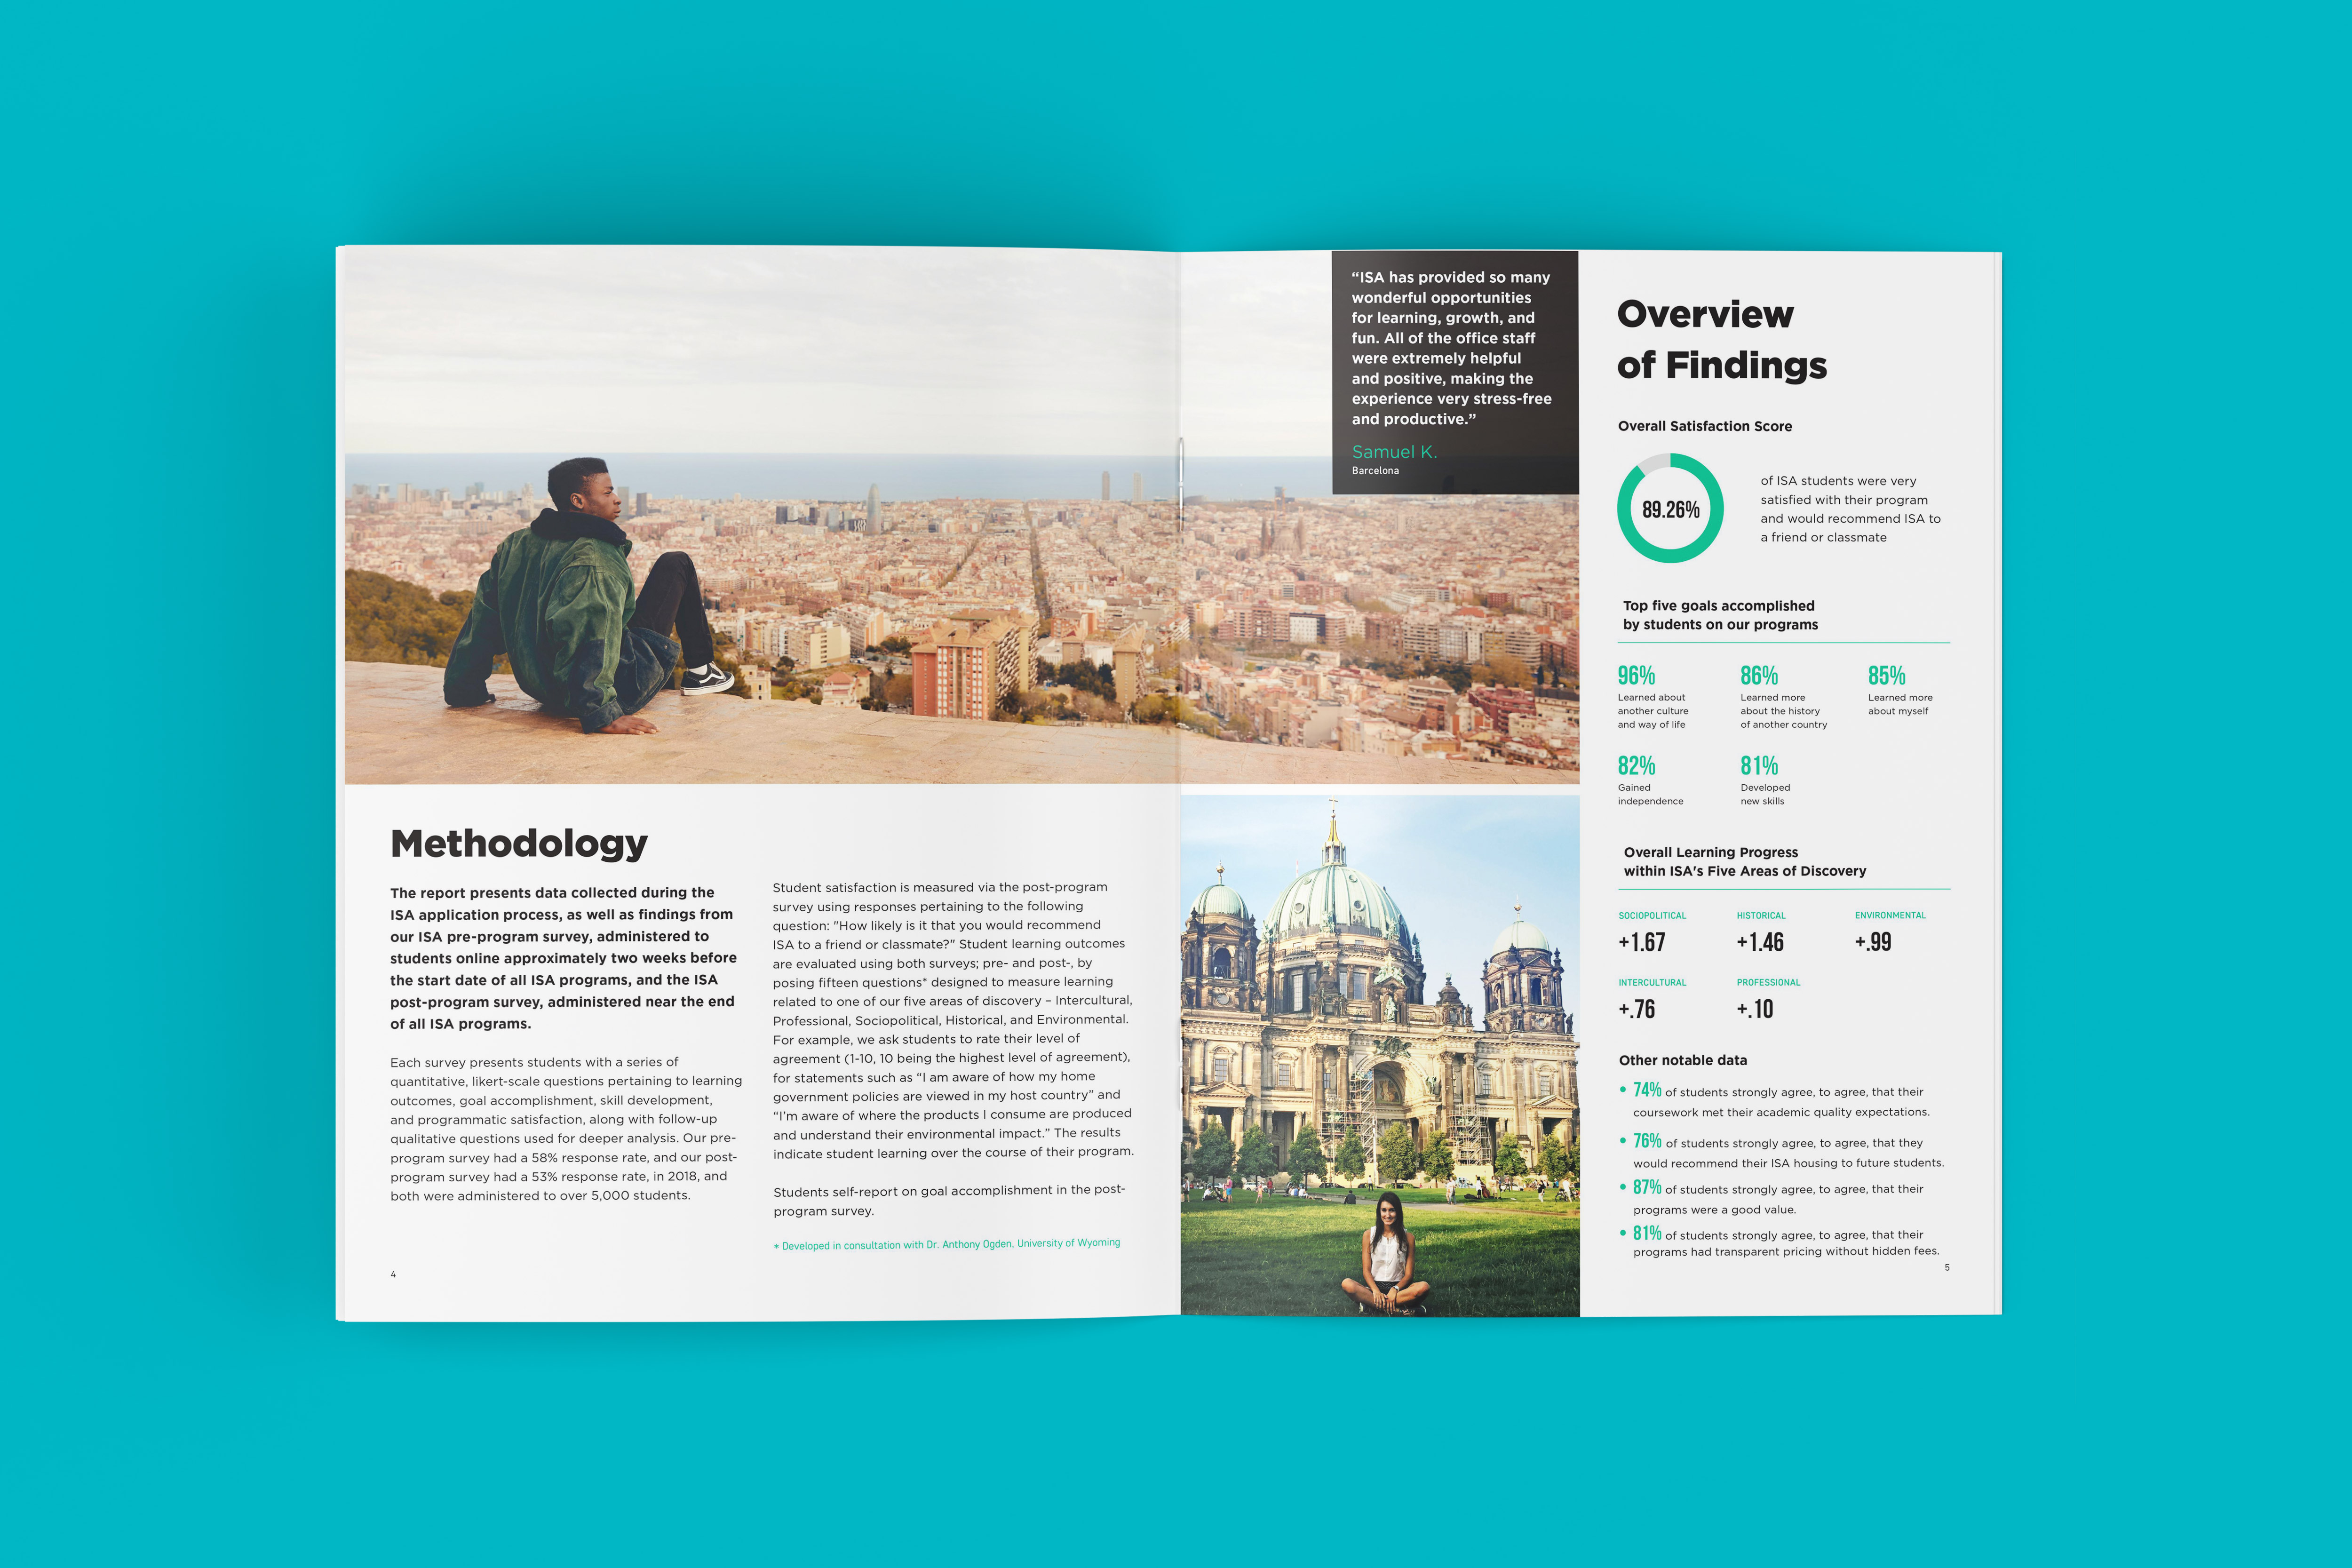
Student Learning and Satisfaction Report

Roles
- Data Visualization Design
- Infographic Design
- Print Design
Company
WorldStrides
Austin, TX
Converting raw survey data into meaningful insights for continuous program improvement.
ISA needed to present student data to university partners. I designed a comprehensive booklet that transformed complex data into clear insights.
Before
Survey data was in raw spreadsheets and basic charts. Partners couldn't easily understand program impact, and teams struggled to identify improvements.
Design Solution
Created a structured reporting format with visual data storytelling, organizing findings into clear sections for outcomes, satisfaction, and recommendations. Through thoughtful layout and infographics, I made complex data accessible to stakeholders.
Impact
Became an essential tool for university partnership renewals and program evaluation. Enabled data-driven decisions that improved student experiences and strengthened ISA's competitive position.